
WHITEPAPER ON UAM SERVICE AVAILABILITY – EXAMINING 10 EUROPEAN CITIES
WHITEPAPER ON UAM SERVICE AVAILABILITY – EXAMINING 10 EUROPEAN CITIES
Have you ever wondered which European cities are best suited for UAM operations?
In our recent whitepaper, we have examined and compared the UAM service availability of 10 major European metropolitan areas.
In our recent whitepaper, we have examined and compared the UAM service availability of 10 major European metropolitan areas.

The whitepaper is based on historical weather data from the last three years to understand the prevailing weather conditions in each city.
This provides the basis for understanding how weather can impact UAM service availability and which factors have the strongest influence.
The whitepaper is based on historical weather data from the last three years to understand the prevailing weather conditions in each city.
This provides the basis for understanding how weather can impact UAM service availability and which factors have the strongest influence.
Weather Parameters & Classification
Weather Parameters & Classification
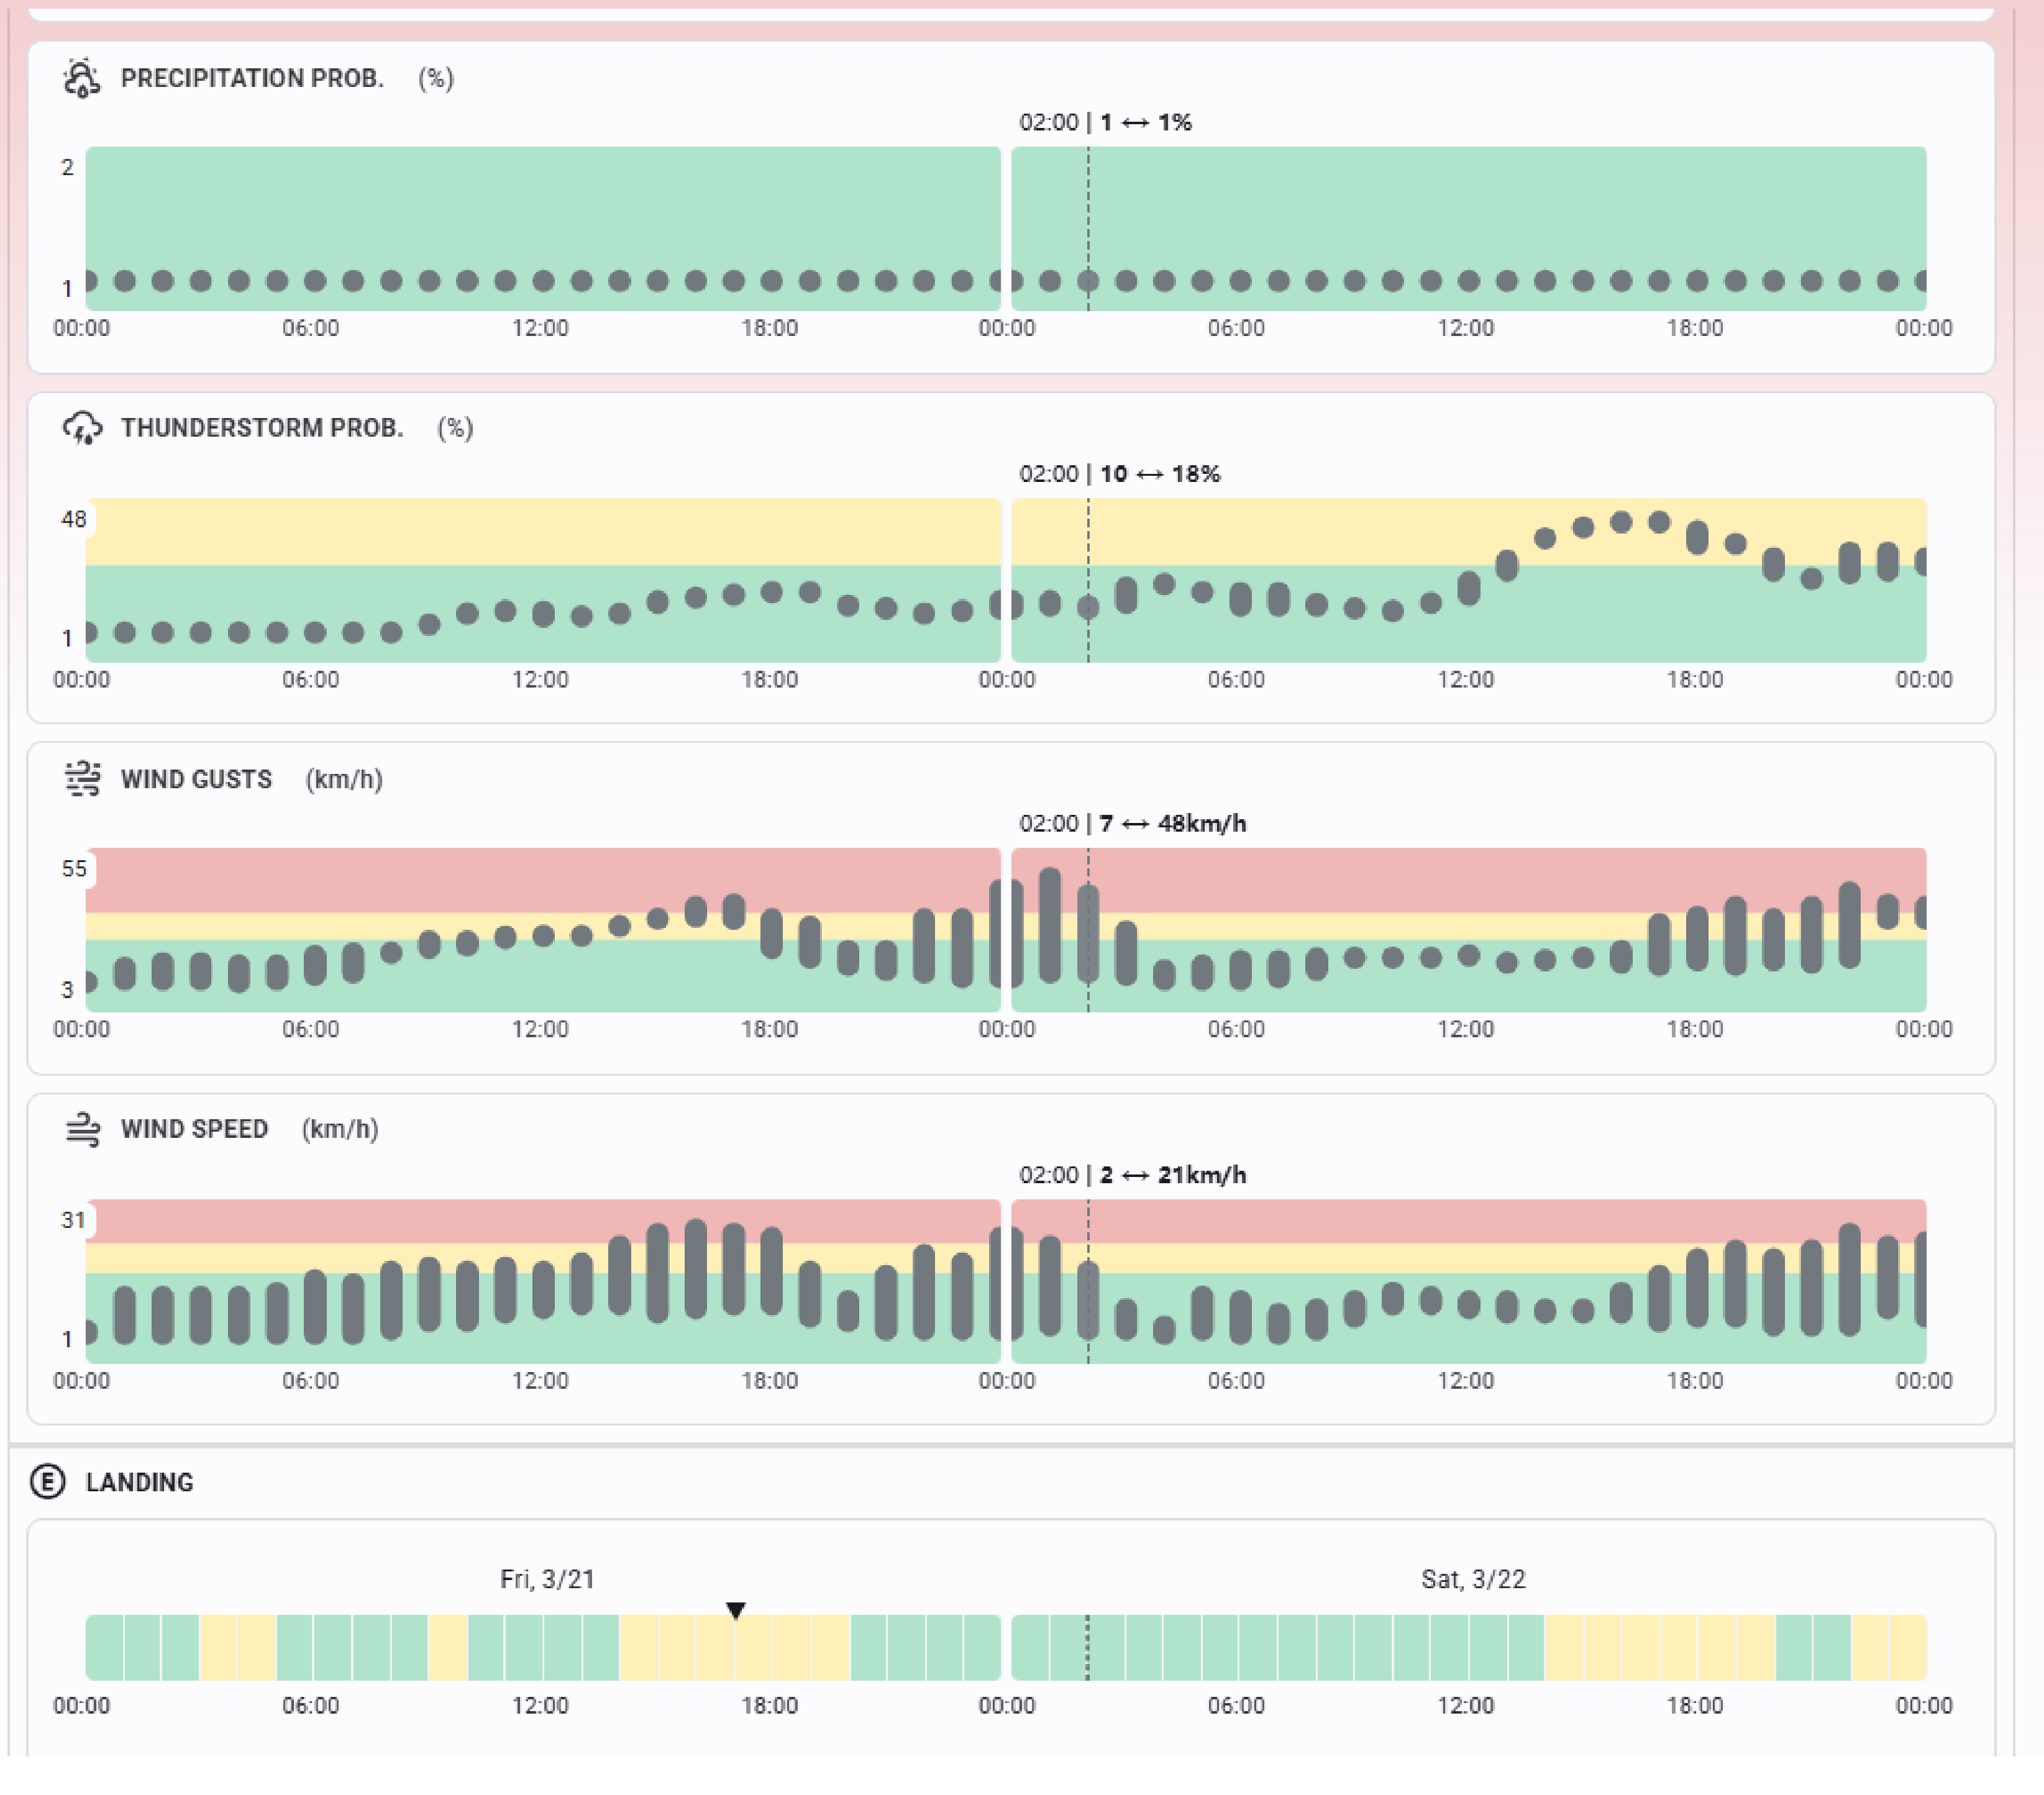
For assessing the UAM service availability 15 weather parameters were analyzed over the past three years (2018-2020) using historic weather data.
The parameters were classified into three types of conditions:
For assessing the UAM service availability 15 weather parameters were analyzed over the past three years (2018-2020) using historic weather data.
The parameters were classified into three types of conditions:
nominal
moderate
severe
nominal
moderate
severe
These are defined as follows:
These are defined as follows:


The Main Findings
The Main Findings
● The metropolitan areas such as Rome or Athens have among the highest UAM service availability in Europe.
● London has the lowest service availability at 50% and has very strong seasonal effects that make it difficult to operate in the winter months.
● Gusts are the main reasons for causing severe weather conditions for UAM operations.
The figure below shows the percentage of time per year with nominal conditions for 12 selected countries in Europe.
The 12 countries are composed of the country with the highest and lowest service availability and the 10 countries of the respective cities that were analyzed.
The figure below shows the percentage of time per year with nominal conditions for 12 selected countries in Europe.
The 12 countries are composed of the country with the highest and lowest service availability and the 10 countries of the respective cities that were analyzed.

In general, the analysis presented in this whitepaper shows that there are strong differences in the prevailing weather conditions among the 10 largest European cities.
For some cities, a high service availability can be expected throughout the year (e.g., Rome or Madrid), whereas other cities show strong seasonal differences (e.g., London or Berlin).
This insight should be an integral part of the decision-making process before setting up a Vertiport and the flight operations.

Results of the analysis can vary depending on the aircraft limits that are selected.
The study also reveals that the parameter “Gust Factor” is the driving parameter throughout all the cities assessed. It is followed by “Visibility” in cities giving rather calm conditions such as Athens.
Being aware of the very loose constraints set for “OAT” and “Rain Amount“ could certainly change with a specification of an eVTOL.
Method & Technology
Method & Technology
For analyzing the weather conditions, we used elements of our Smart 4D Trajectory technology.
The technology consists of:
For analyzing the weather conditions, we used elements of our Smart 4D Trajectory technology.
The technology consists of:
1. Digital Twin Technology that creates an accurate simulation of any air taxi or drone flight, considering aircraft performance models, operational limitations, terrain data, and high-resolution weather data, and
2. Smart Evaluation Algorithm that automatically assesses the digital twin for weather risks, the overall flight feasibility, and derives a validated flight plan.
For the location analysis that was conducted in this whitepaper, we used the Smart Evaluation Algorithms to automatically evaluate the weather data.
You can download the full report here if you want to learn more and see all the results and analysis for each of the 10 cities: Whitepaper
We welcome your feedback and ideas for expanding the analysis to other weather parameters and other countries!


